by admin | Mar 29, 2014 |
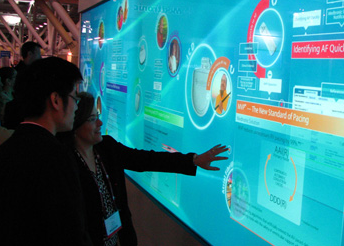
Multi-Touch Interactive Displays Some background and documentation on interactive experiences. Medtronic I worked in a team to develop a presentation tool for composing multi-touch experiences for Medtronic trade shows and events. The editor software managed a user library of images, videos, and PDF documents. 2011 Perot Museum I worked on five touch screen exhibits for the opening of the Perot Museum of Nature and Science in Dallas, TX. The exhibits were developed as AIR Desktop applications. 2012 Adobe Customer Experience Center I was the lead developer on two of the interactive experiences for the opening of Adobe’s new Customer Experience Center in San Jose, CA. The Adobe Corporate Social Responsibility (CSR) experience highlighted Adobe’s commitment to environmental sustainability. An additional community involvement section showcased ten projects from Adobe Youth Voices created by young digital artists from around the world within a multi-touch user interface. The Adobe Museum of Digital Media (AMDM) experience allowed visitors to explore and interact with the AMDM website via a touchscreen monitor within an app that resolved special case touch events and optimized the site for touch. I collaborated with the Kenwood Group on these interactive experiences as part of the reinvention of the Adobe Systems Headquarters into a state-of-the-art interactive briefing center. 2011...
by admin | Mar 17, 2012 |
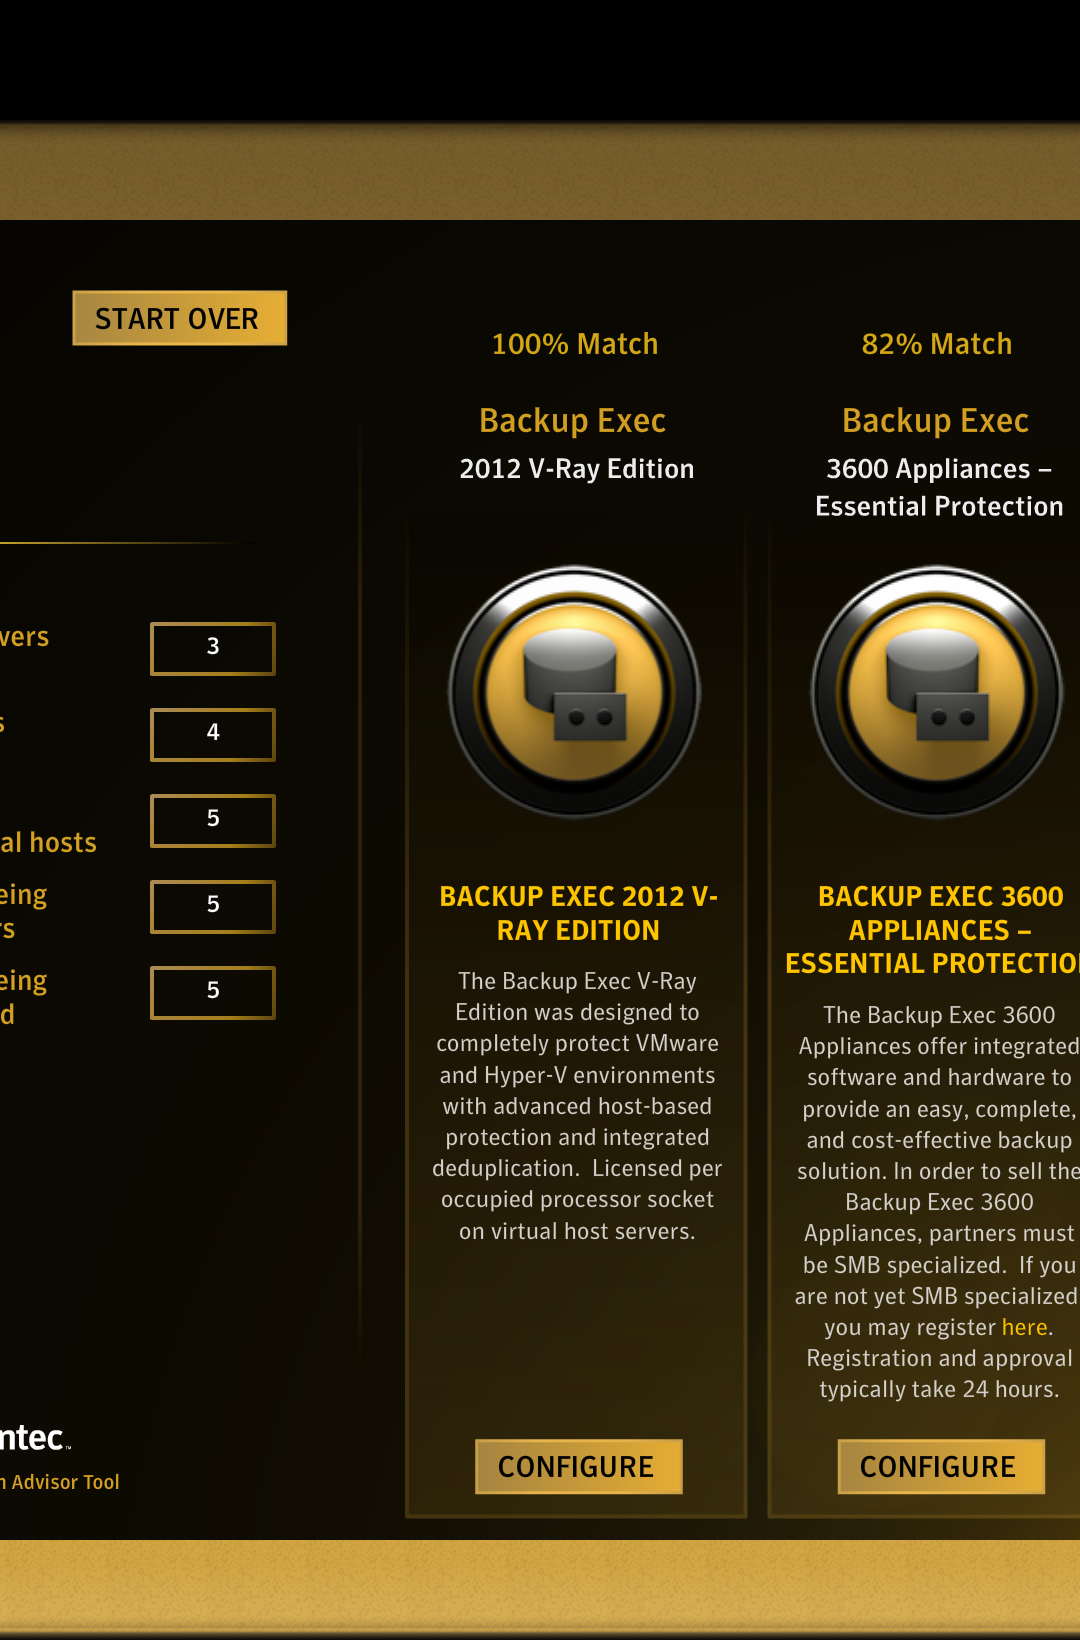
Symantec Backup Configuration Advisory Tool I was the developer on a new Backup Configuration Advisory Tool for Symantec. The tool takes Symantec’s line of backup products and generates appropriate recommendations based on a user’s backup needs. The project involved translating some rather complicated logic & Excel spreadsheet formulas into Flash logic–first calculating the MSRP in dollars for each product based on a user’s backup needs (amount of TB of storage, Windows/Mac/Linux machine, if cloud storage is needed, number of virtual hosts, number of preprocessor sockets), then returning a list of the top three percentages estimating each product’s cost-efficiency. Diagnostics The user is asked some preliminary questions about their backup needs to narrow down the selection. I implemented a custom weighted slider for the TB selection. Smart Results Answers are weighted and combined with the filters presented on the results page to calculate the top three most cost-effective backup options for the user, as well as a percentage for each match. Relevant filters are displayed on left based on the preliminary questionnaire. In this example, updating the total number of physical servers and the number of databases backed up on physical servers updates the matches. Users can view more details about a match and configure customized backup solutions. Choose from different licenses. Product SKUs are listed for the user to print, email, or copy to clipboard. Attention to detail. I added this little detail to help users read the product SKUs more easily. The SKU product number highlights in yellow on mouse over, and a box delineates additional product license SKUs for after the first...
by admin | Jun 17, 2008 |
by admin | Mar 18, 2008 |
...